
|
|
 |
|
 |
| |
|
|
|
Postgraduate |
| |
Using partial aggregation in complex structural equation modeling (SEM):
Application to cooperative product innovation |
| |
|
|
Tania von der Heidt
Southern Cross University |
| |
|
|
| Where the research task involves collecting quantitative strategic data from senior management, low response rates and corresponding small sample sizes tend to be the norm. When structural equation modelling (SEM) is proposed, the challenge of undertaking sound research can be further compounded by the need to test a complex research model. A simple statistical technique which can help in this case is data reduction through partial aggregation of measurement models within the structural model. This paper provides a brief review of literature on aggregation and composites – the foundation for aggregation. Then it illustrates the use of partial aggregation in SEM for a six-factor model of cooperative product innovation, including three distinct factors characterising interorganisational relationships (IORs) in relation to four different stakeholder groups. The outcomes of this approach are a set of well-fitting SEM measurement models and structural models at an overall multi-stakeholder level and a stakeholder-specific level. |
| |
Introduction
The present-day strategic business researcher using structural equation modeling (SEM) is faced with a dual problem: On the one hand, strategic-level research models are expected to deliver new or more in-depth insights, meaning that they are often more complex. On the other hand, sample sizes are declining, as it is becoming increasingly difficult to obtain the requisite primary data from key informants in business, particularly at the CEO/General Manager-level. The literature shows that the rate of response refusal is growing (Groves and Couper 1998) and that attitude toward research becomes more negative as the frequency of being surveyed increases (Helgeson, Voss & Terpening 2002).
Fortunately, complex structural models can be assessed at different levels of ëabstractioní (Bagozzi & Heatherton 1994) also referred to as aggregation or data reduction (Hair, J, F. Jr. et al. 2006). Adopting the appropriate level of aggregation allows researchers to perform meaningful tests of model fit, despite small achieved sample size. This paper compares the main approaches to aggregation and discusses the nature of composites, the building blocks of aggregation techniques. Next, it illustrates the use of the partial aggregation technique within a structural model of multi-stakeholder cooperative product innovation.
Approaches to aggregation
In their research into the measurement of personality constructs, Bagozzi and Heatherington (1994) observed that there was considerable uncertainty and disagreement about how to represent these constructs. Part of the problem lies in the range of interpretation on measure specificity (Ironson et al. 1989), i.e. facet, composite or global, as is discussed later. A related problem is the failure of researchers to consider different levels of abstraction in modeling constructs (Bagozzi & Heatherton 1994). Three (Bentler & Wu 1995) or four (Bagozzi & Heatherton 1994) approaches to aggregation of SEM models are recommended in the literature. Bagozzi and Heatherington’s conceptualization distinguishes two extremes in model assessment called aggregation (most abstract) and total disaggregation (least abstract). In between these two extremes of model assessment are partial aggregation and partial disaggregation. These four techniques are described below and a comparative summary is provided in Table 1.
- Total aggregation develops a single composite variable made up of the sum of all items measuring a construct (Bagozzi & Heatherton 1994). Such an approach constitutes an aggregation of both dimensions and items. The main advantages of the total aggregation model are simplicity - the ability to capture the essence of the underlying meaning of a concept - and the smoothing of random error (Bagozzi & Heatherton 1994; Baumgartner & Homberg 1996). However, it should only be used in situations where measures share sufficient common variance and where the unique properties of subdimensions is not required (Bagozzi & Heatherton 1994).
- The partial aggregation approach involves the aggregation of the indicators of each dimension of the overall construct, whereby each separate underlying factor is retained (Bagozzi & Heatherton 1994). In such a case, a composite variable is created from the items of each separate dimension of the construct and become a single indicator of a single factor model. SEM confirmatory factor analysis (CFA) can then be performed to test an overall model. Baumgartner and Homberg (1996) recommend that these composites be created from scales for which unidimensionality and reliability are established. This approach to model assessment provides greater substantive content for each variable within a smaller matrix, less distraction from accumulated errors and, thereby, greater reliability (Bentler & Wu 1995; Loehlin 1992). Partial aggregation has been used to assess complex models, such as Morgan and Hunt’s (1994) commitment-trust theory of relationship marketing and Syamil, Doll et al.’s (2004) model of product development process performance.
- A more fine-grained analysis can be performed using partial disaggregation, in which each dimension is represented as a separate latent variable indicated by two or more composites of subscales (Bentler & Wu 1995; Dabholkar, Thorpe & Rentz 1996). The composites may be created from identified subdimensions of an indicator construct of the overall latent construct (Bagozzi & Heatherton 1994) or items may be allocated and aggregated randomly as “it is expected that any combination of a construct’s variable indicators should yield the same model fit” (Dabholkar, Thorpe & Rentz 1996, p. 10). Partial disaggregation provides particular benefits of permitting hypothesis testing about construct structure, however conclusions about discriminant validity may be ambiguous (Bagozzi and Heatherton 1994).
- Total disaggregation uses each item as a separate indicator of the relevant construct. This provides the most detailed level of analysis for model testing (Bagozzi & Heatherton 1994) with psychometric properties able to be reported for each individual item. However, using this approach can also lead to high levels of error and reduced model fit, especially when there is a large number of items and attendant increased sample size (Bagozzi & Heatherton 1994).
Depending on the researcher’s objective, different levels of abstraction may be used. As a rule, when the researcher’s objective is to test global hypotheses, such as the meaning of the construct, total aggregation or partial aggregation are appropriate. When specific hypotheses are of interest, e.g. the differential implications of multi-faceted dimensions of the construct of interest, partial disaggregation or total disaggregation models are appropriate (Bagozzi & Heatherton 1994).
Table 1 Comparison of aggregation frameworks
| |
Aggregation |
Partial aggregation |
Partial disaggregation |
Disaggregation |
| Level of abstraction |
Molar, least detailled, most abstract |
More molecular |
Most molecular |
Atomistic, most detailed, least abstract, |
| Construct dimensions |
Combined |
Separate, organised as indicators of an underlying factor |
Separate, organised as separate latent variables |
Separate latent variables |
| Items within dimension |
Summed into one composite |
Summed into one composites for each dimension
|
Summed into 2+ composites for each dimension
|
Separate |
| Pros |
Simplicity, smoo-thing of error to the degree that measures share sufficient variance |
Some simplicity, yet sufficient substantive content, some psychometrics (reliability) as parameter and measurement error estimates are available |
Some simplicity and sufficient substantive content, permits hypothesis testing about construct structure |
Most detailled reporting of psychometrics |
| Cons |
Failure to represent unique properties of subdimensions |
Some obscuring of unique dimensions |
Random error and measure specificity are confounded, conclusions about discriminant validity may be ambiguous |
High levels of random error due to many parameters requiring estimation, greater risk of poor model fit |
| Sample size required |
Smallest |
Smaller |
Large |
Largest |
| Purpose |
Global hypotheses |
Global hypotheses |
Specific hypotheses |
Specific hypotheses |
Adapted from Bagozzi and Heatherton (1994), Hair, Black et al. (2007)
Composites: The foundation for aggregation
The comparative advantage of composite scales
The aggregation framework applies to multi-faceted scales or single latent variables indicated by many items, such as composites; it does not apply to single-faceted or global scales (Bagozzi & Heatherton 1994). Before making the case for composites, the three main types of scale need to distinguished:
- Facet (specific) single or multi-item scales are intended to cover, separately, the principal areas within a more general domain (Ironson et al. 1989). The scale measuring each individual facet should be internally homogeneous and discriminably different from the others (Einhorn 1972).
- Global scales employ single items that elicit overall impression and summary evaluations. Global scales are sometimes referred to as ‘clinical’ combinations (Ironson et al. 1989) because they require respondents to combine their evaluations cognitively into a global judgement (Ironson et al. 1989).
- Composite scales assume the whole is equal to the sum of its principal parts (Einhorn 1972). They sometimes require explicit summing of the facets and are sometimes referred to as mechanical composites (Einhorn 1972). Both for predicting a criterion and for representing the overall evaluations of raters, unit-weighted additive linear models have been found to be adequate (Kumar, Stern & Achrol 1992).
In the case of applied and managerial research involving constructs (or latent variables), the application of composites (or mechanical combinations) has increased (Hair, Black et al. 2006). Composites can represent the multiple aspects of a concept in a single measure. In this way they address the researcher’s dilemma to accommodate the richer descriptions of concepts by using multiple variables, while also maintaining parsimony in the number of variables in the multivariate model (Hair, J, F. Jr. et al. 2006). The predicative ability of composites is superior to that of global evaluations (Einhorn 1972). In comparison with global questions, specific questions underlying a composite scale help informants cope with complexity by structuring their task, thereby reducing measurement error and enhancing the probability of obtaining convergence between informant reports (Hair et al. 2006).
Compared with the proxy, e.g. the single highest-loading variable, the composite is often better, as it represents multiple facets of a concept. Compared with factor scores, which reflect the factor loadings (low and high) of all variables on the factor, the composite is easier to replicate across studies and easier to interpret. Overall, the composite is viewed as a compromise between the use of a single proxy variable and factor score options for data reduction (Einhorn & Hogarth 1975). Furthermore, when relationships with other constructs (as opposed to variables) are the focus of inquiry, the general (i.e. global and composite) measures of performance provide a better fit than the individual facet scales (Kumar, Stern and Achrol 1992).
Composite weighting schemes
Combining component variables into a composite involves deciding (1) how multiple criterion measures are to be weighted and combined into a composite criterion measure, (2) how symptoms and signs are to be weighted and combined into a clinical judgement (Einhorn & Hogarth 1975). These authors examined two weighting schemes - linear multiple regression and unit- (or average-) weighting: Linear regression models yield weights that are optimal in terms of minimising squared error, but consume degrees of freedom in the estimation of those weights. Both for predicting a criterion and for representing the overall evaluations of raters, unit-weighted additive linear models (linear composites) have been found to be a viable alternative to standard regression methods because unit weights (1) are not estimated from the data and therefore to not 'consume' degrees of freedom, (2) are estimated without error (have not standard error), (3) cannot reverse the 'true' relative weights of the variables and (4) incorporate prior knowledge into the analysis. Provided that one can state the sign of the zero-order correlation between the independent and dependent variables, one can confidently use a unit-weighting scheme. Also, the unit- or average-weighted scheme has the appeal of a democratic procedure which would be particularly suited to pooling the judgments of experts (Einhorn 1972).
An illustration of partial aggregation within a structural model of multi-stakeholder cooperative product innovation IORs
Summary of research model development
Academic interest in analysing the relationship between innovative performance of small and medium-sized enterprises (SMEs) and their recourse to external resources, especially through interorganisational relationships (IORs) has been growing over the last ten to fifteen years. To date the emerging literature has given limited attention to the systematic empirical assessment of the relationship and innovation inputs and outputs of cooperative product innovation. Furthermore, most of the literature focuses on cooperative innovation IORs with customer stakeholders, ignoring the potential role played by other external stakeholder groups, such as suppliers, industry partners and research/advisory organisations.
Building upon prior models of cooperative IORs, including Robicheaux and Coleman’s (1994) strategy-structure-performance-based conceptual model of marketing channel relationship structure, a six-factor multi-stakeholder model of cooperative IORs in product innovation for Australian manufacturers was developed. The research model synthesised and incorporated concepts and measures drawn from the IOR and product innovation literatures.
The central, IOR structure-based factor or construct (measurement model) developed was Stakeholder Involvement in Product Innovation (SIPI). Two factors were used to predict SIPI: Stakeholder Orientation (SO) and Product Innovation Orientation (PIO). A further two factors represented outcomes of SIPI: Relationship Quality (RQ) and Product Innovation Performance (PIP). A sixth factor - Overall Firm Performance (OFP) - was also measured to assess the broader implications of the model. Two objective, single-item variables were also included in the model – relative Product innovation spending (associated with PIO) and Sales growth (associated with OFP). The three IOR-oriented constructs SO, SIPI and RQ were specified for each of the four external stakeholder groups most likely to be involved in a manufacturer’s product innovation – customer, supplier, industry partner and research/advisor. The six-factor model contained sixteen multi-item measurement models totaling 153 observable variables (indicators) and involved 21 hypothesised associations. The hypotheses and a preview of their results (standard coefficients) are presented in Table 2.
Table 2 Results of hypothesised associations (std. coefficients)
| Hypo-thesis |
Association |
Stakeholder type |
Overall
model |
| Customer |
Supplier |
Industry partner |
Researcher |
| H1 |
SO-SIPI |
.53 *** |
.76 *** |
.77 *** |
.79 *** |
.98 *** |
| H2 |
PIO-SIPI |
.15 * |
n.s. |
n.s. |
n.s. |
-.12* |
| H3 |
Relative PI spending- SIPI |
n.s. |
n.s. |
n.s. |
n.s. |
n.s. |
| H4 |
PIO-SO |
.35 *** |
.45 *** |
.29 *** |
.29 *** |
.48 *** |
| H5 |
Relative PI spending- SO |
n.s. |
n.s. |
n.s. |
.18 * |
n.s. |
| H6 |
SIPI-RQ |
n.s. |
.26 ** |
.42 *** |
.35 *** |
n.s. |
| H7 |
SIPI-PIP technical |
n.s. |
n.s. |
.12 * |
n.s. |
n.s. |
| H8 |
SIPI-PIP market |
n.s. |
n.s. |
n.s. |
n.s. |
n.s. |
| H9 |
RQ-PIP technical |
n.s. |
n.s. |
n.s. |
n.s. |
n.s. |
| H10 |
RQ-PIP market |
n.s. |
n.s. |
n.s. |
n.s. |
n.s. |
| H11 |
RQ-OFP |
n.s. |
n.s. |
n.s. |
n.s. |
n.s. |
| H12 |
RQ-Sales growth |
.17 * |
n.s. |
n.s. |
.27 *** |
.27 *** |
| H13 |
SO-RQ |
.33 *** |
.33 *** |
.50 *** |
.53 *** |
.63 ** |
| H14 |
Relative PI spending-RQ |
n.a. |
.14 * |
n.a. |
n.a. |
.15 * |
| H15 |
SIPI-OFP |
n.a. |
-.20 * |
n.a. |
n.a. |
n.s. |
| H16 |
Relative PI spending-PIP technical |
|
|
|
|
.21*** |
| H17 |
PIP technical-PIP market |
|
|
|
|
.36*** |
| H18 |
PIO-PIP technical |
|
|
|
|
.67*** |
| H19 |
PIO-PIP market |
|
|
|
|
.40*** |
| H20 |
PIP technical-OFP |
|
|
|
|
-.37*** |
| H21 |
PIP market-OFP |
|
|
|
|
.71*** |
*** p <.001; ** p<.01; * p < .05; n.s. = not significant; n.a. = not applicable
As strategic data was required, the research method for primary data collection was a survey of CEOs/General Managers of Australian machinery and equipment manufacturers, predominately small and medium-sized manufacturing enterprises (SMMEs). The sample was obtained from four machinery and equipment industry associations’ membership databases. Standard questionnaire design actions and response management strategies were implemented to address the typical problem of non-response error associated with mail surveys. However, in this highly competitive and, generally, declining manufacturing sector, survey fatigue and lack of time were two major obstacles to achieving adequate survey response rates. Difficulties were also encountered identifying qualified SMMEs (i.e. those with a sufficiently significant manufacturing base). Data obtained from 120 key informants was used in the research. The survey response rate averaged 12%, ranging from 3.5% of respondents sourced from the Telstra database to 28% to 44% of respondents affiliated with three machinery and equipment-based manufacturing industry associations.
Sample size issues
Sample size provides the basis for the estimation of sample error and impacts on the ability of the model to be correctly estimated (Hair, J, F. Jr. et al. 2006). As with any statistical method, the critical question is how large a sample is needed? Bentler and Chou (1987) suggest that in SEM the sample size requirements vary for measurement and structural models. In an ideal case, the following Bentler and Chou (1987) rules of thumb need to be satisfied in order to test measurement and structural models:
Measurement models
A ratio of ten responses per free parameters is required to obtain trustworthy estimates (Bentler & Chou 1987). Others suggest a rule of thumb of ten subjects per item in scale development is prudent (Flynn & Pearcy 2001). However, if data is found to violate multivariate normality assumptions, the number of respondents per estimated parameter increases to 15 (Bentler & Chou 1987; Hair, J, F. Jr. et al. 2006). In this research, each of the constructs to be measured had four to seven indicators, i.e. eight to fourteen parameters. Applying Bentler and Chou’s 10:1 rule of thumb, a sample size of 80 to 140 was required. Applying Flynn and Pearcy’s (2001) rule of thumb, a sample size of 40 to 70 would suffice. A split sample (n = 60) used to cross-validate the model met Flynn and Pearcy’s criterion, but fell just below Bentler and Chou’s rule.
Structural models
A ratio of five responses per free parameter is required to obtain trustworthy estimates (Bentler & Chou 1987). With a total (maximum) of 153 observables or indicators, i.e. maximum of 306 free parameters, the effective sample size required to test the trustworthiness of the model would be 1530. However, a sample size exceeding 400 to 500 becomes ‘too sensitive’, as almost any difference is detected, making all goodness-of-fit measures indicate poor fit (Hair, JF, Jr et al. 1995). Furthermore, given the survey limitations, this sample size was far from achievable. For a meaningful model assessment, some form of data reduction was required.
Converting measurement models to composites
In specifying the structural model, the partial aggregation approach was considered most appropriate for two reasons: (1) It retained the separate (four stakeholder) dimensions of the three multi-stakeholder or IOR constructs (SO, SIPI and RQ); (2) It provided an assessment of the multi-stakeholder model of cooperative product innovation that was less distracted by accumulated error, due to the large number of items used in the model.
Each of the sixteen constructs of interest was operationalised using a multi-item scale. Unidimensionality was assessed at the facet (first-order construct) level (e.g. for each of the four stakeholder groups – customer, supplier, industry partner and research/advisor), rather than for the entire scale, as per Kumar, Stern et al. (1992). Psychometric testing provided the following results:
-
The incremental fit measures goodness-of-fit index (GFI) index and comparative fit index (CFI) of ≥ 0.90 for each measurement model conveyed strong evidence of unidimensionality (Byrne 2001). Absolute fit indices recommended for use when evaluating SEM models are chi-square (χ2) p>0.05, normed chi-square (χ/df2) 0.5 to 3.0 (Holmes-Smith & Coote 2002), standardised Root Mean-square Residual (SRMR) ≤ .05 (Hair, J, F. Jr. et al. 2006) and Root Mean-Square Error of Approximation (RMSEA) ≤ .10 (Browne & Cudeck 1993; Hair, J, F. Jr. et al. 2006). The fit indices indicated that all the models met these acceptable levels for these values and, hence, fitted the data well. An exception was the measurement model for technical-oriented product innovation performance, which was just-identified and could not be fully evaluated.
-
Following recommendations (Bagozzi & Yi 1988; Baumgartner & Homberg 1996; Fornell & Larcker 1981; Hair, J, F. Jr. et al. 2006), composite reliability and average variance extracted (AVE) was computed for every multiple indicator construct in this research. All constructs met acceptable levels used for composite reliability of. ≥ 0.70 and ≥ 0.50 for AVE.
-
Construct validity (a measure’s correspondence with other measures) was assessed in terms of convergent and discriminant validity (Campbell and Fiske 1959; Ping 2004).
- Convergent validity (extent to which a measure correlates highly with other measures of the same construct) was indicated by significant standardised latent variable loadings of 0.7 or higher (Anderson & Gerbing 1988; Hair, J, F. Jr. et al. 2006). All items loaded on their respective constructs, and each loading was large and significant at the .01 level.
- Discriminant validity (extent of low correlations between the measure of interest with other measures of the same construct) was tested by comparing the variance-extracted percentages for any two constructs with the square of the correlation estimate (r2) between those two constructs (Fornell & Larcker 1981). The variance-extracted estimates of all paired constructs used in the research were greater than the squared correlation estimates (Hair, J, F. Jr. et al. 2006; Ping 2004), hence the measures passed the discriminant validity test.
Following satisfactory psychometric testing, all of the variables loading highly on each of the measurement models were combined using the simple average unit weighting (for reasons spelled out earlier), and the average score of variables was used as the replacement variable. In other words, new variables for use by replacing each measurement model with a single summated scale or composite.
Specifying structural models with aggregated measurement models (composites)
Two types of structural models of stakeholder cooperation in product innovation using composites were developed: (1) One overall (multi-stakeholder) model; (2) Four specific stakeholder models, i.e. one each for customer, supplier, industry partner and researcher/advisor.
Overall (multi-stakeholder) structural model
The overall structural model to be tested contained a total of 16 composites:
-
12 composites, representing four composites (customer, supplier, industry partner and research/advisor) for each of the three second-order, stakeholder-based constructs (SO, SIPI and RQ) and
-
four 1 composites relating to the remaining three first-order factors (PIO, PIP and OFP).
In addition, two single-item measures (product innovation spending and sales growth) were included in the structural model. Given a sample size of 120, the resulting 18-variable model provides seven cases per measured variable, compared with 15 cases per predictor in standard ordinary least squares multiple regression (University of Texas 2002) and Bentler and Chou’s (1987) five cases per parameter.
Specific stakeholder structural models
To test whether there were significant differences between stakeholder types in the extent to which they were involved in a manufacturing firm’s product innovation, four specific stakeholder models were developed. Each of these four models contained nine measured variables (composites) with 13 cases per measured variable. This is more consistent with the recommended guidelines of the University of Texas (2002). All four stakeholder models were specified the same way.
Fit of structural models
The overall (multi-stakeholder) structural model, as well as four single-stakeholder models, of key relationship- and innovation-oriented antecedents and consequences of cooperative product innovation were tested using SEM AMOS 6.0 software. Meaningful modifications of the hypothesised model were undertaken to improve model fit.2 As is shown below, the four modified single-stakeholder models and the overall (multi-stakeholder) model were found to provide a satisfactory fit. Statistically significant standard coefficients for each of the latent constructs provided evidence of the importance of each element as an input or outcome of cooperative innovation.
Modified overall (multi-stakeholder) model
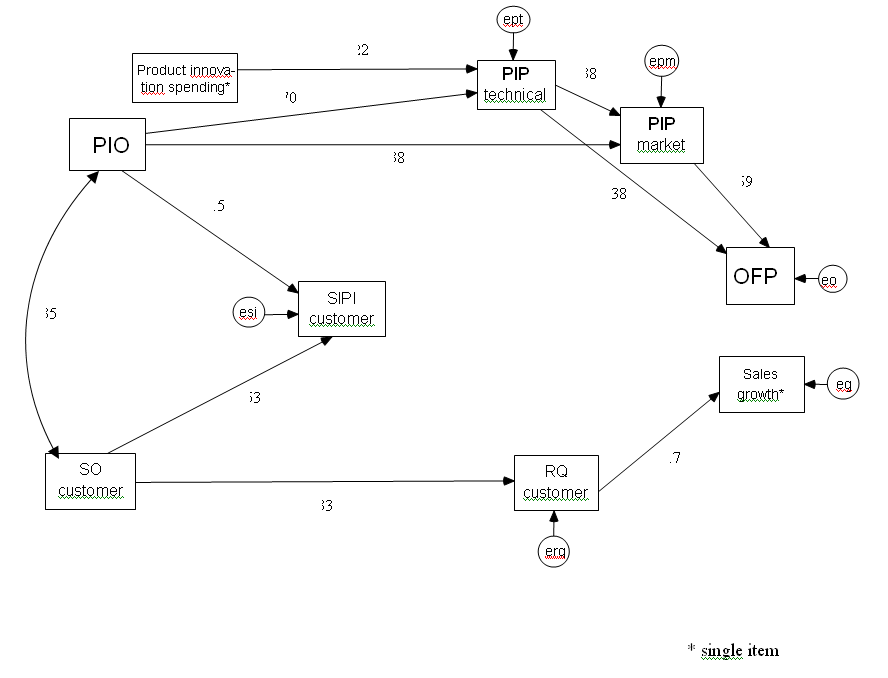
A mostly acceptable fit to the data was found, with critical fit indices falling within acceptable limits: Normed Chi-Square X2/df = 1.370; CFI = 0.967. The residual fit indices provided further evidence of satisfactory fit (RMSEA = 0.056; SRMR = 0.060). The probability of significant difference between the observed (empirical) S and estimated (implied) Σ covariance matrices was calculated (p = .006). The final model for the overall (multi-stakeholder) model showing significant standardised coefficients is presented in Figure 1. It contains 12 paths significant at P ≤ .05 and one path with a lower significance level - PIO to SIPI (p = .079).
Figure 1 Final overall (multi-stakeholder) model of IORs for cooperative product innovation

Modified single-stakeholder models
As reported in Table 3, a good fit to the data was found for all fit indices for all four single-stakeholder models. To illustrate, the customer model of cooperative product innovation IORs is shown in Figure 2.
Table 3 Fit indices for single-stakeholder models
| Fit index |
Customer |
Supplier |
Industry partner |
Researcher/advisor |
Values indicating good fit |
| X2 (df) |
17.758 (18) |
10.787 (6) |
6.931 (18) |
12.328 (17) |
|
| P |
.472 |
.822 |
.991 |
.780 |
> .05 |
| X2/df |
.987 |
.672 |
.385 |
.725 |
≥ 3 |
| SRMR |
.046 |
.030 |
.035 |
.027 |
≤ .08 |
| RMSEA |
0 |
0 |
0 |
0 |
≤ .08 |
| GFI |
.969 |
.981 |
.987 |
.978 |
≥ .09 |
| CFI |
1.0 |
1.0 |
1.0 |
1.0 |
≥ .09 |
Figure 2 Final customer model of IOR for cooperative product innovation
Conclusions
While data reduction through partial aggregation is not new, its application in a business research context, particularly at the strategic level, is on the rise. This is largely explained by an increase in the complexity of research models and the decline in achieved sample sizes with which to test these models. Perhaps it also reflects a growing interest by researchers in considering different possible levels of abstraction in representing constructs of interest, as hoped for by Bagozzi and Heatherington (1994).
The application of partial aggregation presented in this article shows how it helps researchers scrutinise global hypotheses, especially those associated with limited sample size and a complex model at two levels: (1) the level of a combined or overall model of second-order (multi-dimensional) factors (e.g. a firm’s cooperative product innovation IORs with four different stakeholders) and (2) the level of an individual model of first-order (e.g. stakeholder specific) factors. In this challenging situation, partial aggregation can provide researchers with a meaningful and satisfactory assessment of measurement and structural models in SEM, which may otherwise not be possible. This is particularly useful in the under-researched and hard-to-research area of business strategy pertaining to interorganisational relationships (IORs) between focal firms and multiple stakeholder groups. I hope that this illustration of partial aggregation and its considerable advantages stimulates interest into its use as an alternative form of model abstraction in-between total aggregation and disaggregation.
|
| |
| Footnotes |
- Originally PIP was conceived as one-dimensional, but subsequent testing revealed two dimensions.
- Modifications comprised the addition of four post-hoc theorised direct paths and inclusion of error correlations between error terms for stakeholder-specific composites relating to SO, SIPI and RQ. In spite of proven discriminant validity having been shown to exist, these variables had the same measurement scale and represented a series of questions on different aspects of a related topic, i.e. the nature of the interorganisational relationship (IOR). In addition, when classifying their attitudes toward their relationship with the top firm in each stakeholder group, the respondent had answered the questions relating to each stakeholder group in the same way. These two reasons provided theoretical support for the use of correlated errors (Dunne, Everitt et al. 1993; Kline 2003).
|
| |
| References |
| |
Anderson, JC & Gerbing, DW 1988, 'Structural equation modeling in practice: A review and recommended two-step approach', Psychological Bulletin, vol. 103, no. 3, pp. 411-23.
Bagozzi, RP & Heatherton, TF 1994, 'A general approach to representing mulitfaceted personality constructs: Application to self-esteem', Structural equation modeling, vol. 1, no. 1, pp. 35-67.
Bagozzi, RP & Yi, Y 1988, 'On the evaluation of structural equation models', Academy of Marketing Science, vol. 16, no. 1, pp. 74-94.
Baumgartner, H & Homberg, C 1996, 'Applications of structural equation modeling in marketing and consumer research: A review', International Journal of Research in Marketing, vol. 13, pp. 139-61.
Bentler, PM & Chou, C-P 1987, 'Practical issues in structural modeling', Sociological Methods & Research, vol. 16, no. 1, pp. 78-117.
Bentler, PM & Wu, EJC 1995, EQS for Windows User's Guide, Mulitvariate Software Inc., Encino, CA.
Browne, MW & Cudeck, R 1993, 'Alternative ways of assessing model fit', in KA Bollen & JS Long (eds), Testing Structural Equation Models, Sage, Newbury Park, CA, pp. 136-62.
Byrne, B 2001, Structural Equation Modeling with AMOS. Basic Concepts, Applications and Programming, Lawrence Erlbaum Associates, Mahwah, NJ.
Dabholkar, PA, Thorpe, DI & Rentz, JO 1996, 'A measure of service quality for retail stores: Scale development and validation', Journal of Academy of Marketing Science, vol. 24, no. 1, pp. 3-16.
Einhorn, HJ 1972, 'Expert measurement and mechanical combination', Organizational Behavior and Human Performance, vol. 7, pp. 86-106.
Einhorn, HJ & Hogarth, RM 1975, 'Unit weighting schemes for decision making', Organizational Behavior and Human Performance, vol. 13, pp. 171-92.
Flynn, LR & Pearcy, D 2001, 'Four subtle sins in scale development: Some suggestions for strengthening the current paradigm', International Journal of Market Research, vol. 43, no. 4, pp. 409-23.
Fornell, C & Larcker, DF 1981, 'Evaluating structural equation models with unobservable variables and measurement error', Journal of Marketing Research, vol. 18, no. 2, pp. 39-50.
Hair, J, F. Jr., Black, WC, Babin, BJ, Anderson, RE & Tatham, RL 2006, Multivariate Data Analysis, 6th edn, Pearson Prentice Hall, Upper Saddle River, NJ.
Hair, JF, Jr, Anderson, RE, Tatham, RL & Black, WC 1995, Multivariate Data Analysis, 4th edn, Prentice Hall, Englewood Cliffs, NJ.
Helgeson, JG, Voss, KE & Terpening, WD 2002, 'Determinants of mail-survey design factors and respondent factors', Psychology & Marketing, vol. 19, no. 3, pp. 303-28.
Holmes-Smith, P & Coote, L 2002, Structural equation modelling: From the fundamentals to advanced topics, School Research Evaluation and Measurement Services, Elsternwick, Vic.
Ironson, GH, Smith, PC, Brannick, MT, Gibson, WM & Paul, KB 1989, 'Construction of a job in general scale: A comparison of global, composite and specific measures', Journal of Applied Psychology, vol. 74, no. 2, pp. 193-200.
Kumar, N, Stern, LW & Achrol, RS 1992, 'Assessing reseller performance from the perspective of the supplier', Journal of Marketing Research, vol. 29, no. May, pp. 238-53.
Loehlin, J, C. 1992, Latent Variable Analysis, Lawrence Erlbaum Associates Inc., Hillsdale, NJ.
Morgan, RM & Hunt, SD 1994, 'The commitment - trust theory of relationship marketing', Journal of Marketing, no. Jul. Ping, RA 2004, 'On assuring valid measures for theoretical models using survey data', Journal of Business Research, vol. 57, pp. 125-41.
Robicheaux, RA & Coleman, J 1994, 'The structure of marketing relationships', Journal of the Academy of Marketing Science, vol. 22, no. Winter, pp. 38-51.
Syamil, A, Doll, WJ & Apigian, CH 2004, 'Process performance in product development: Measures and impacts', European Journal of Innovation Management, vol. 7, no. 3, pp. 205-17.
University of Texas 2002, Structural equation modeling using AMOS: An Introduction, Information Technology Services, viewed 16/8/06 2006. |
| |
| |
| AUTHOR BIOGRAPHY |
| |
Tania von der Heidt wrote this paper as part of work towards her PhD at Southern Cross University. She has subsequentily received her PhD in innovation and strategic marketing from Southern Cross University and is now a Lecturer in marketing in the School of Commerce & Management at SCU. Her current research interests include interorganisational cooperation in product innovation, environmental regulation of Australian railways and the EU-Africa energy partnership.
The author wishes to thank her supervisor, Don Scott, and two anonymous reviewers for their helpful comments and the Federation of Automobile Products Manufacture, Austool and Australia Business Limited for access to their membership databases.
|
| |
| |
BACK TO TOP
Close window to return to contents |
|
| |
|
|
| |
|
|
 |
|